Before you write off PowerPoint as good for making only slideshows, it’s worth investigating more closely. PowerPoint has most of the tools small businesses need to create simple graphics. And because you’re already familiar with PowerPoint, using it to make graphics will be quicker and easier than trying to learn new applications.
Save your time and your sanity; check out the PowerPoint tools and features you can use to make your own small business graphics.
Create Great Graphics in PowerPoint
1. Combine Text and Photos
Social media and blog posts all benefit from great images, and combining photos with text is simple in PowerPoint. Start with a new slide and add your photo using Insert > Picture. Choose Insert > Text Box and draw a text box over the image. Add your text inside the box and format it as desired.
To add a fill color, select the text box, choose Drawing Tools > Format tab and choose a color from the Shape Fill box. Alternately, from the Shape Fill dropdown choose More Fill Colors to choose a fill color and to make it semitransparent. Add a border using Drawing Tools > Format tab > Shape Outline.
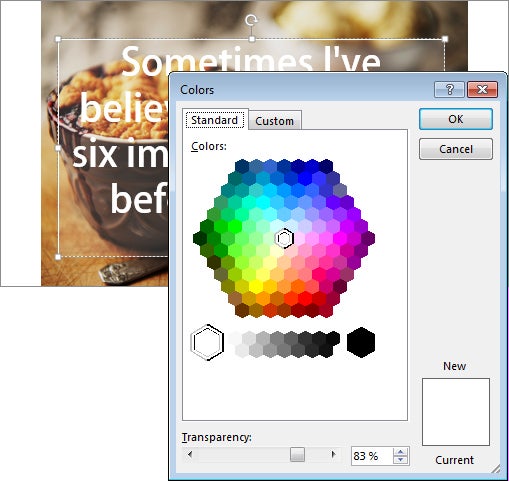
Combine photos and text in PowerPoint to make great graphics for tweets and social media posts.
2. Save Images in Graphic File Formats
You can save your graphics as files that you can use in other applications. Select all the elements that comprise a graphic, right-click and choose Save as Picture. Type a file name and click to save the image as a PNG file, which retains any transparency in and around the objects.
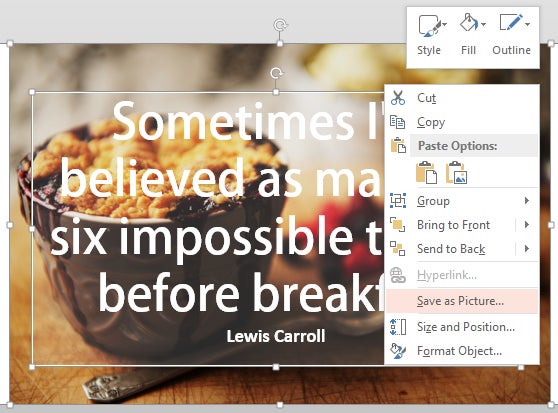
You can select all the graphic objects and then save them as an independent graphics file to use in another application.
3. Create Vector Graphics
You can create simple vector graphics in PowerPoint—for use in infographics and charts—either by drawing freehand shapes or by combining shapes to make more complex ones. Use the shape tools (introduced in PowerPoint 2010 & 2013) to combine shapes. In PowerPoint 2013, you’ll find these tools on the Drawing Tools > Format tab in the Merge Shapes collection.
In PowerPoint 2010, you can add them to the Quick Access Toolbar (QAT) by choosing File > Options > Quick Access Toolbar. From the Choose Commands From dropdown list select All Commands and scroll to locate and add the following commands: Shape Union, Shape Intersect, Shape Subtract and Shape Combine. Click OK when you are done.
PowerPoint 2013 includes one additional command—Shape Fragment—which is not available in PowerPoint 2010.
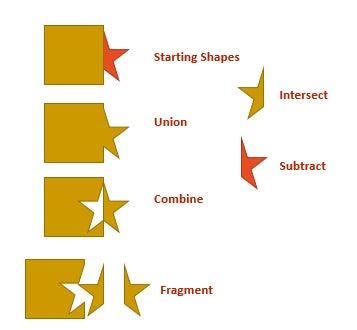
PowerPoint 2013 has five merge shape options that you can use to make shapes for infographics.
You can make people icons by using three rounded rectangles—one for the body and two for the legs—and a circle. Arrange the shapes; then select the leg and body shapes, and choose Merge Shapes > Union to merge them into a single shape. To place the circle above the body, right-click and choose Bring Forward > Bring to Front.
![]()
Create a simple person icon from rounded rectangles and a circle.
4. Handy Graphics Tools
When assembling graphics, PowerPoint has lots of tools in addition to the Merge Shape options. You can group shapes using Drawing Tools > Format tab > Group > Group. Grouped shapes move and resize as a single object; use them when you need to center a group of objects relative to another object. You can ungroup shapes using Group > Ungroup to merge or unite them. Note that the order in which you select objects will affect the outcome of commands such as Merge Shapes > Subtract Shapes.
Save your graphics in a PowerPoint file so you can copy them into other slide shows in future where they will adopt the current theme colors.
You can change how objects are layered relative to each other by using the Bring Forward and Send Back options. Use the Align > Align to Selected Objects option to align shapes relative to other selected shapes rather than to the slide. With shapes selected, choose Align > Align Left (to align their left sides); use Align Center to align their centers, and so on. Use Align > Distribute Horizontally to space the shapes so that their horizontal centers are equally spaced. Use Distribute Vertically to distribute the shapes vertically.
When you color shapes using theme colors, they change color whenever you change the color scheme or theme. That won’t be the case, however, when you save an object as a standalone graphic file. If you want to build a library of objects that are “theme aware,” do it in a slide presentation so that you can copy-and-paste the objects into another presentation in future.
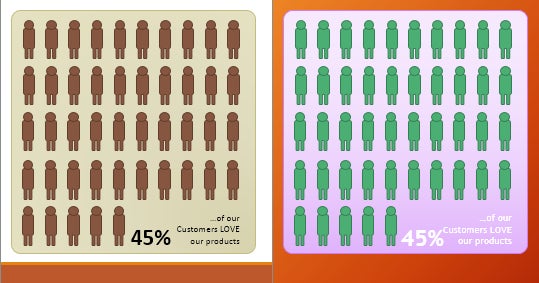
With a little imagination it is possible to create a range of blog and infographic objects inside PowerPoint.
Helen Bradley is a respected international journalist writing regularly for small business and computer publications in the USA, Canada, South Africa, UK and Australia. You can learn more about her at her Web site, HelenBradley.com
| Do you have a comment or question about this article or other small business topics in general? Speak out in the SmallBusinessComputing.com Forums. Join the discussion today! |